Personalize the view, preserve the facts
Preferences change the ordering and depth of the research. They do not change the source records or experimental estimates.
A web prototype with a parallel SwiftUI app project, bringing player statistics, game context, and the reasoning behind the numbers into one research experience. The current web implementation focuses on the NFL.
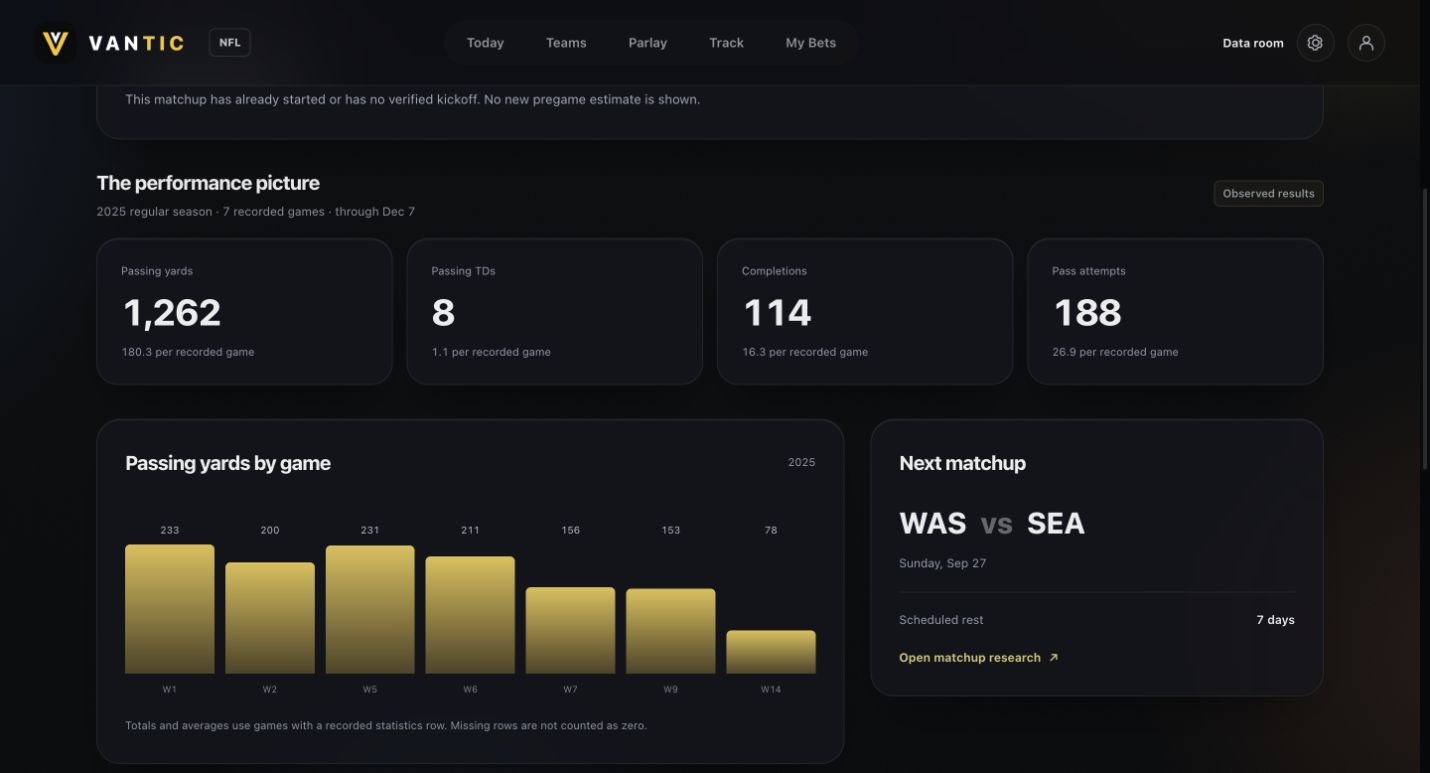
Actual development screens captured September 27, 2026, using the saved September 10 research snapshot. These are historical records, not live game data.
I wanted sports research to be freely accessible and easier to follow. Understanding a player or matchup often means moving between statistics, schedules, injury reports, and separate explanations of what the numbers mean.
Vantic brings that context together. My aim is to let someone start with a clear summary, then follow a number back to its calculation and source when they want to go deeper.
I’m developing the product across its interface and data workflows. My direction has been to preserve a consistent mobile experience, keep the underlying facts shared, and make source attribution and missing information part of the product itself.
Python workflows bring public team, roster, schedule, statistics, and contextual feeds together.
Required inputs are checked before a new snapshot is published. A failed required feed preserves the previous core snapshot.
FastAPI serves the shared research to the React interface, including sample periods, formulas, and source metadata.
Saved research retains its original evidence so it can be compared with the current research later.
Actual screens, with the reasoning beside them
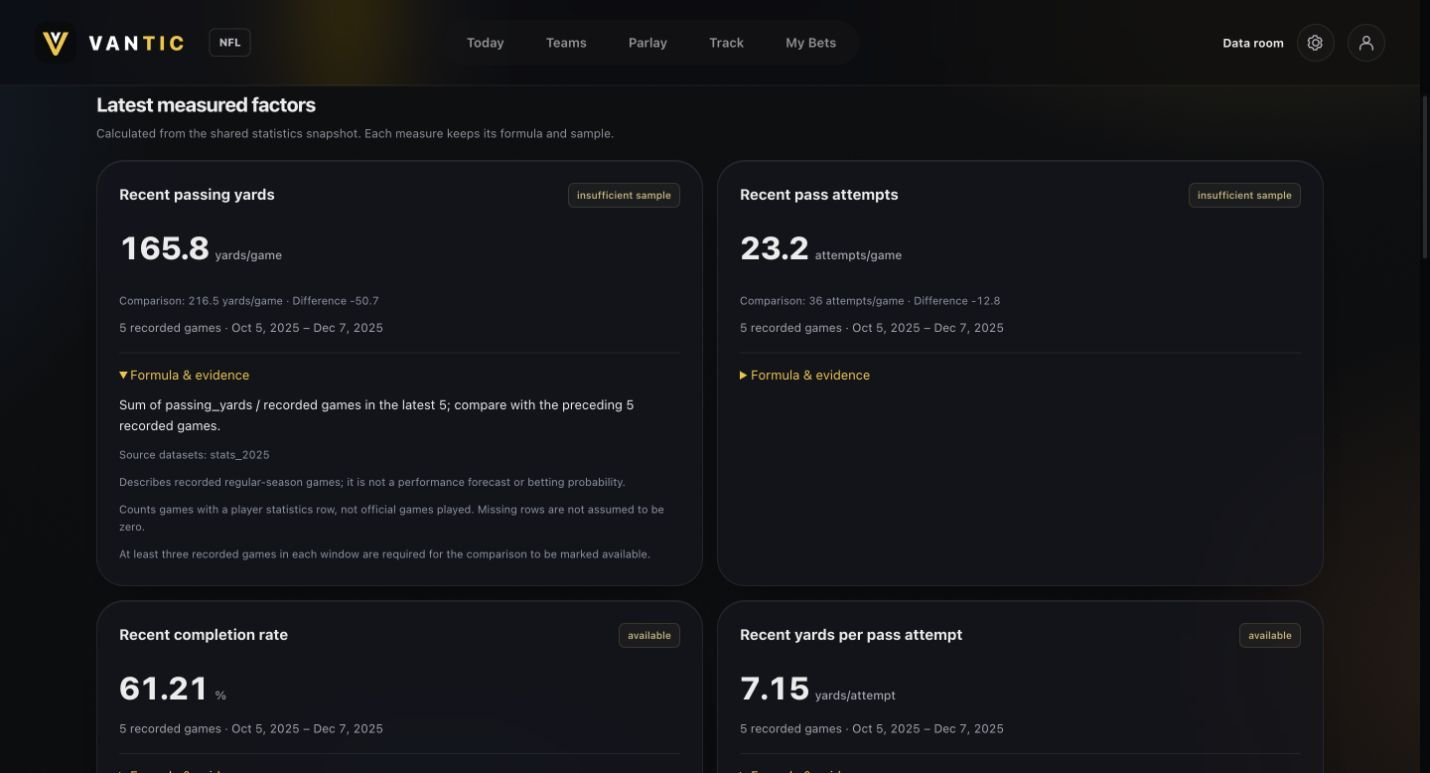
The Factors view pairs each derived measure with its sample, source, and calculation. In this example, the recent passing-yards comparison is marked “insufficient sample”: five recent games are available, but only two earlier observations remain for comparison.
The product still shows what was calculated. It also makes the limitation visible instead of presenting the comparison as a confident forecast.
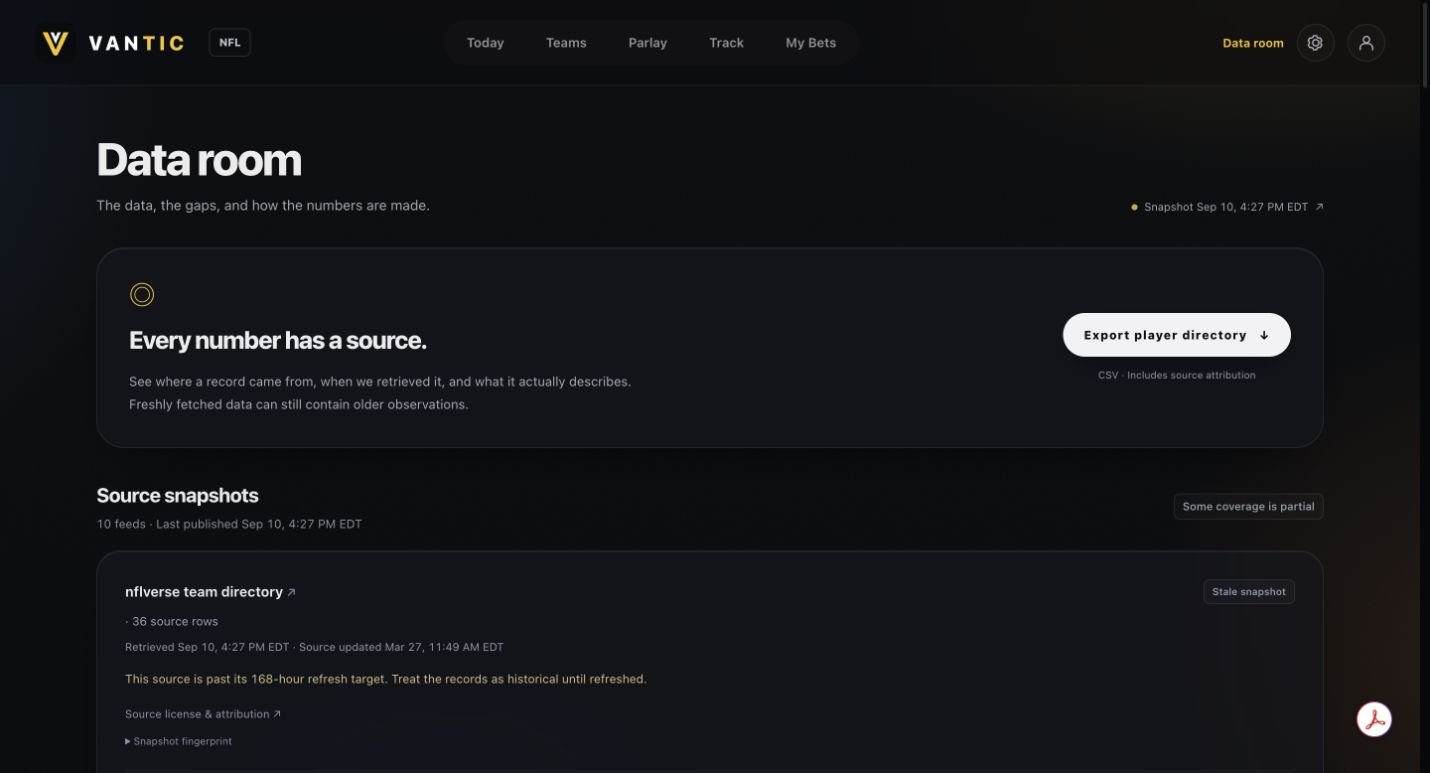
The Data room records where a feed came from, when it was retrieved, and what period it describes. A recently fetched file can still contain older observations, so those are separate pieces of information.
A stale source remains visibly stale. A missing injury report is not treated as proof that a player is healthy, and a missing statistics row is not silently counted as zero.
Preferences change the ordering and depth of the research. They do not change the source records or experimental estimates.
Missing inputs, small samples, and historical model errors belong beside the result, where someone can use them.
Validation and atomic publication protect the core dataset when required feeds fail. Optional feeds update separately.
The web prototype runs locally and supports NFL team and player research, game logs, measured factors, source metadata, and saved research. An experimental baseline has historical evaluation, but it is not an established betting advantage. Live player-prop prices, calibrated betting probabilities, and published NFL picks are not available.
Extend the validated data coverage, improve evaluation across seasons and changed player roles, and prepare the product for a public release.