Build the geographic foundation first
Scenario comparisons need a network whose locations, provenance, and limitations can be inspected.
A map-based prototype that combines Harrisonburg’s public geography and traffic-volume records with a synthetic movement model. It is a foundation for studying demand and, eventually, comparing signal strategies.
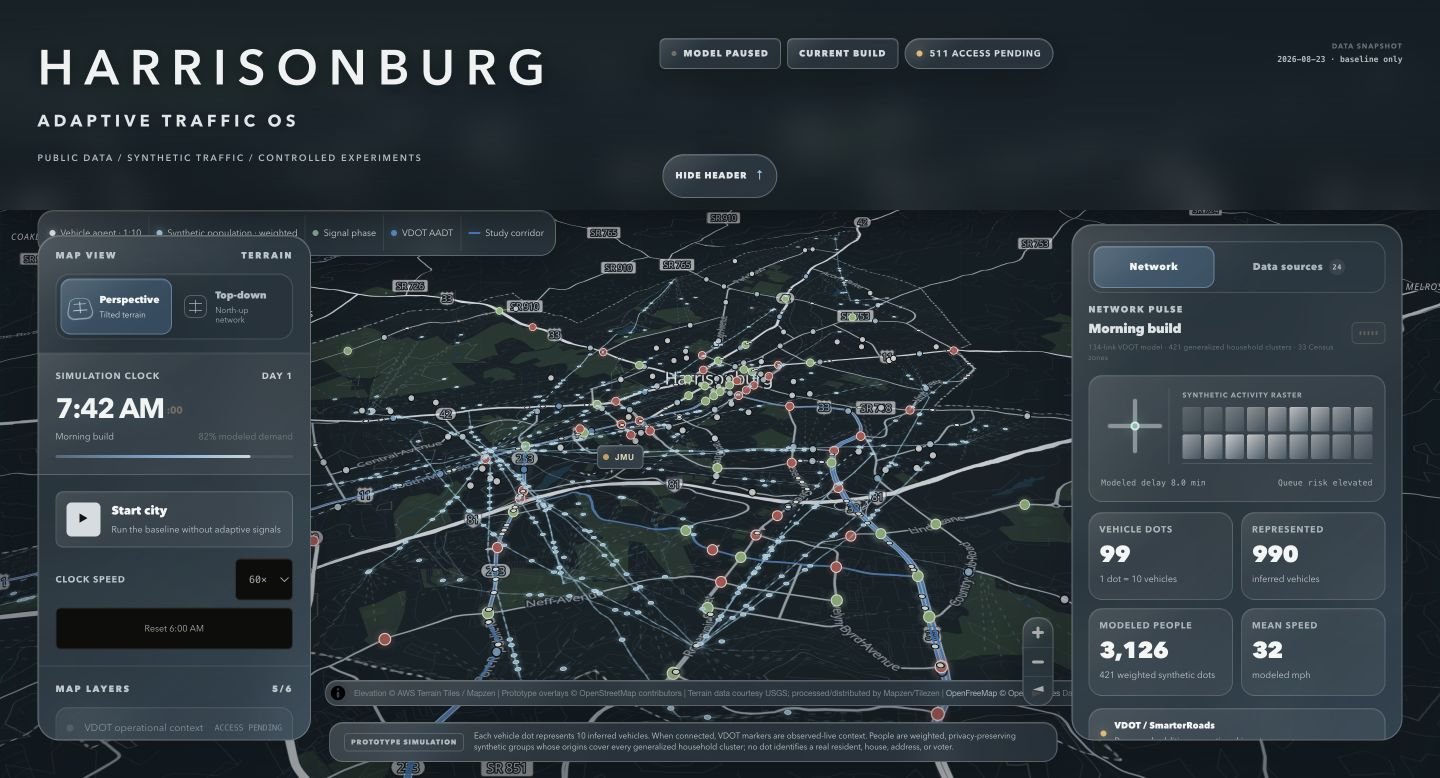
Actual hosted prototype captured September 27, 2026. Public-source records, derived estimates, and synthetic outputs are distinguished in the application. The VDOT live-feed connection remains disabled.
Living and studying in Harrisonburg made me curious about how class schedules, residential trips, businesses, and events concentrate demand at particular intersections. I chose that local problem for my datathon work.
I want to understand the whole city, including residents and commuters alongside JMU students. The longer-term question is whether a data-based simulation can help compare changes before anyone changes a real intersection.
I’m connecting the data and shaping the model around that question. The current build brings geography, annualized road-volume records, aggregate population inputs, and an inspectable simulation interface together. The work is as much about deciding what each dataset can support as it is about drawing moving dots.
Street geometry, the city boundary, terrain, and mapped signal locations establish the geographic context.
VDOT road-volume records and Census-based population and employment-flow inputs feed compact model artifacts.
Time profiles and deterministic routes create weighted vehicle agents and anonymous synthetic population groups.
Layer controls, source lineage, and the intersection inspector expose what is observed, derived, or simulated.
Actual screens, with the reasoning beside them
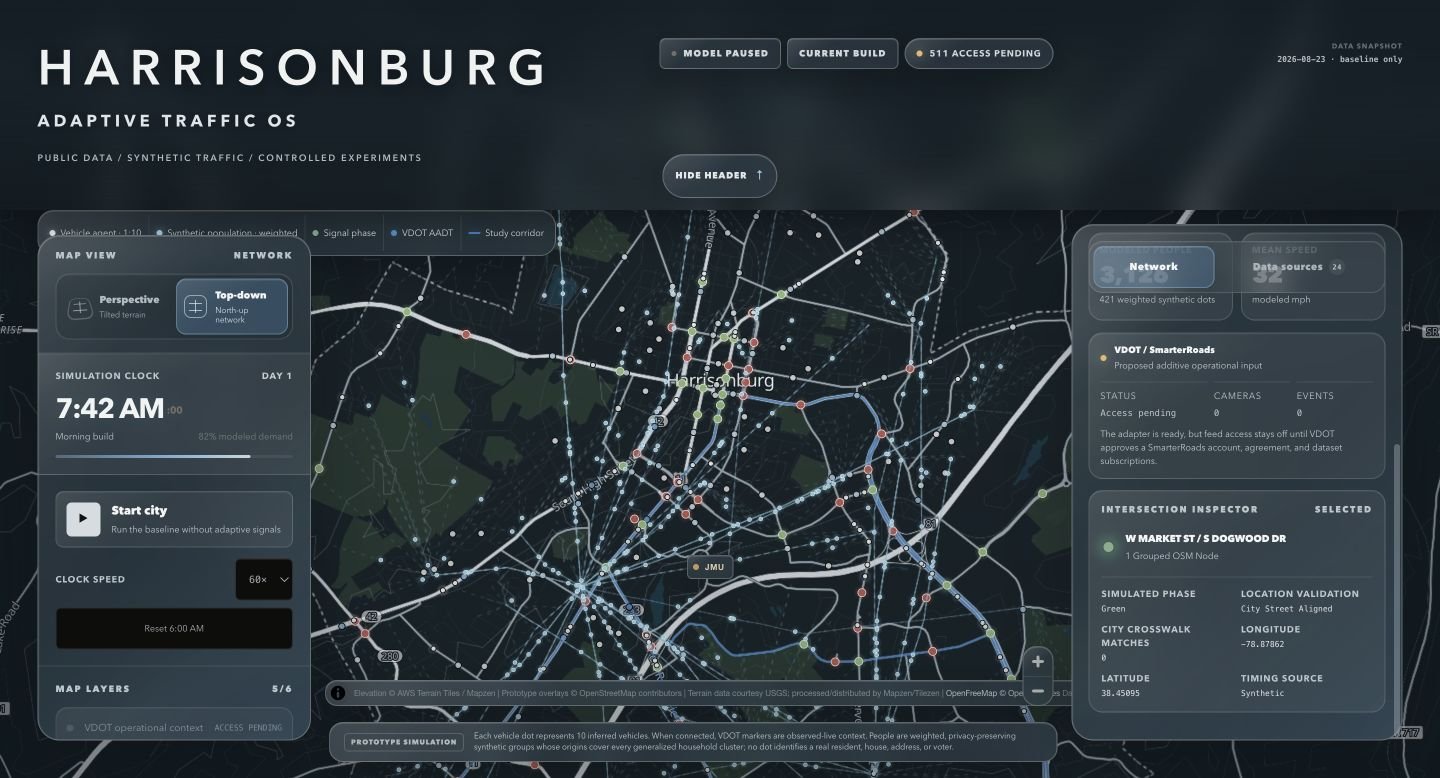
Selecting a signal cluster opens its mapped street names, coordinates, location-validation status, and simulated phase. This example is the West Market Street and South Dogwood Drive location.
A mapped location and a real timing plan are different kinds of evidence. The inspector explicitly labels timing as synthetic; the phase colors are not the city’s operational signals.
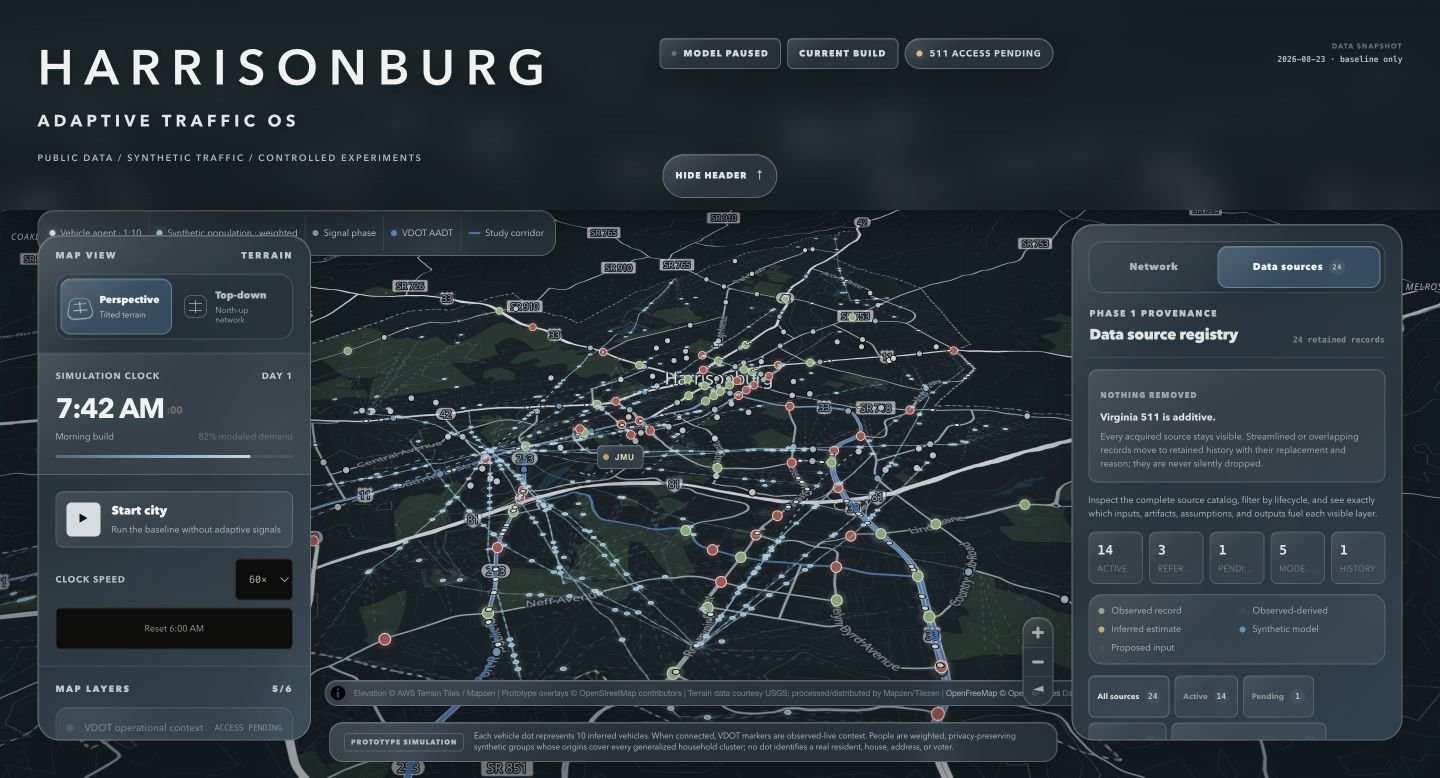
The source registry connects the map’s layers to their input records, transformations, assumptions, and outputs. The inspected build lists 24 retained records, including active inputs, model assets, reference material, and a pending connection.
For example, VDOT’s 2025 road-volume data supplies 134 deduplicated links. Census-based inputs support 33 statistical zones and 421 generalized household clusters. Those aggregates help construct a model; they do not identify individual residents or observed trips.
Scenario comparisons need a network whose locations, provenance, and limitations can be inspected.
Weighted anonymous groups and generalized origins provide citywide context without presenting the movement of real people.
A moving map is not evidence of accurate traffic prediction. The interface identifies provisional demand, signal phases, and presentation metrics.
The prototype has a working map, layers, clock controls, source registry, and intersection inspector. It uses VDOT and Census-derived inputs, but vehicle agents do not yet respond to the displayed signal phases. Delay and queue-risk cards are presentation formulas, not validated traffic-engineering measures. Live VDOT/SmarterRoads access is pending.
Validate network behavior, connect vehicle movement to signal logic, and develop reproducible baseline-versus-adaptive comparisons before claiming that a strategy improves traffic.